
Suspension Testing with Cody Kelley and MotionIQ
Prior to EWS Northstar BikeCo Pro Rider Cody Kelley and Joe Binatena had a chance to work with our friends from Motion Instruments, a Suspension Data Analytics company.
We could write a thesis on it, but to keep it manageable we’re going to break it down into two semi-succinct parts… This section will cover some of the “why” then jump over to the “how”.
Why Data Acquisition
Hard data about suspension narrows the setup dialogue. “I think” or “I feel” turns into “it was doing this.”
Cody Kelley: It’s hard to trust what you “feel” your suspension is doing. Because there are so many variables that go into that… Such as tire pressure, 2 psi can completely change the way your bike tracks the ground and gives you a totally different feeling. There’s a ton of variables in feedback or feeling away from the suspension itself. Trusting what you feel alone is a bit of a roll of the dice.
Joe Binatena: We travel all over the world. Different altitudes, different terrain. Suspension setup is pretty fluid with these factors. Testing with Motion Instruments allowed us to directly quantify what the bike was doing for the Northstar EWS.
Without suspension data Cody and Joe have a few racer tricks on setup. The rubber travel ring, yup the one you have, as well as slow motion video are favorites. Video is hard to acquire across an entire course and fairly subjective. The issue with your travel ring is it’s representative of a single outlier moment.
Cody’s early practice runs weren’t using the fork’s full travel. However, with the Motion Instruments App, MotionIQ, it was simple to review.
Motion Instruments: MotionIQ Histogram

Rob Pryzkucki from Motion Instruments: With data, you can make informed decisions without bias or opinion. Cody and Joe had a debate about fork pressure. They looked at our position histogram and noted he wasn’t using a large percentage of his fork.
Under utilizing travel on courses as rough as the EWS Northstar gives up performance as well as physically effects the rider.
Rob: His g-force readings were high. Basically he’s taking a lot of punches in a fight. Based on the data, they decided to drop a lot of air pressure in his fork. Cody mentioned after the race that it’s the lowest air pressure he’s ever run in his fork without diminishing the positive aspects of high pressure such as adequate rebound support..
Cody: The test results lead us to what I thought were some big changes for sure. Way bigger changes than I have ever made on a race weekend prior to using the data. After every lap we studied the results and made changes to try and achieve more balance on the bike.
Joe: With histogram and mapping data we quickly see what the bike is doing, when. Cody’s setup was too stiff. The histogram allowed us to see that air pressure adjustment was the way to go, rather than air and volume, etc. We have spreadsheet calculators from BikeCo which factor piston PSI at travel allowing us a reasonable guess of PSI and volume changes – but we’re debating PSI, volume or both. Cody, Rob & I all liked the ramp rate we saw in the histogram.
Rob: Cody realized his fork was too stiff looking at this chart. ie: He wanted to shift the curve to the right. So he dropped air pressure.

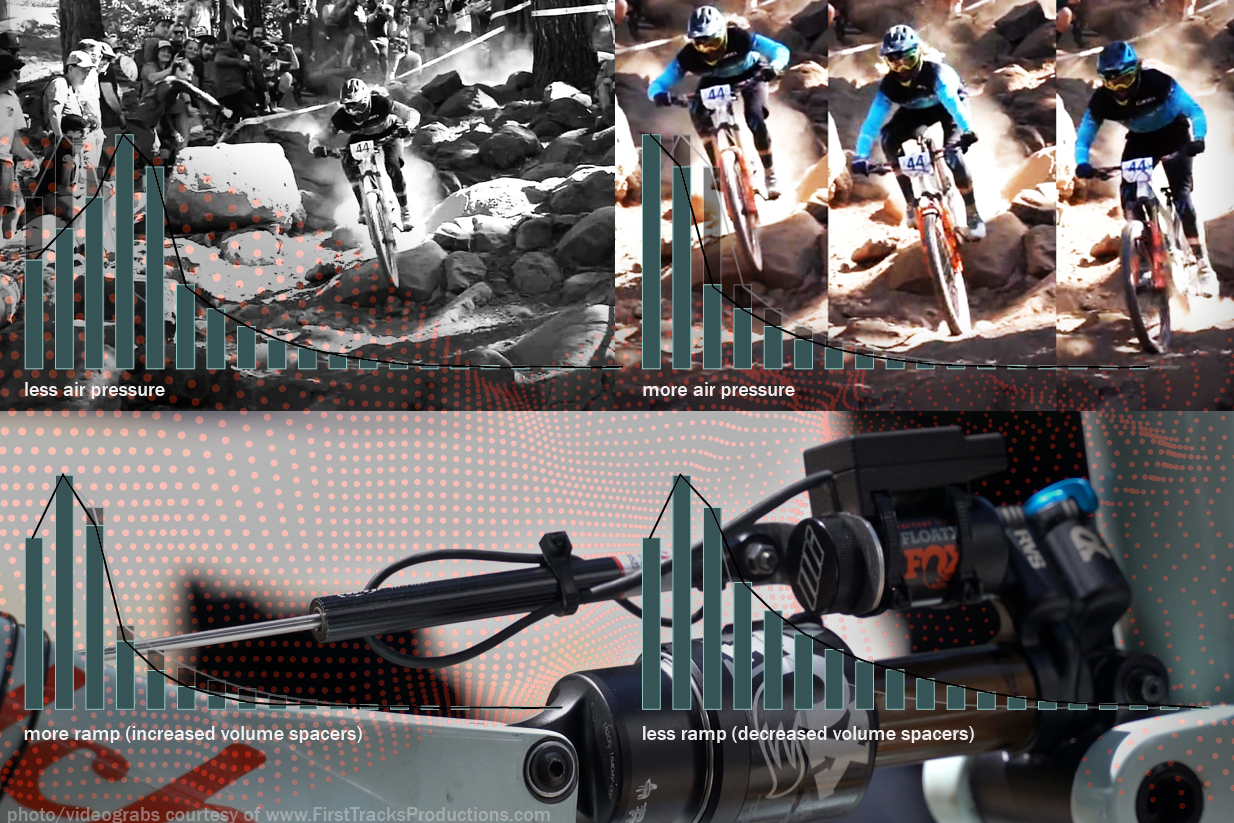
To move it left, add air pressure
To move it right, remove air pressure
The increase the ramp, how fast it rolls off, add tokens. To decrease the ramp, widen out the hump, remove tokens.
The histogram provided a critical data point unavailable from the travel ring. How the fork was ramping not to mention exact percentages that it was deep in the travel. This negated working with both volume and psi. But most importantly it gives the team visual confirmation they’re headed in the right direction. Each removed doubt gives you improved focus on your run. You’ve got the right tires. You’re trained up. Now you can demystify your suspension. Front and rear.
MotionIQ Front & Rear Comparison
For riders in search of the ultimate data set, Motion Instruments will be releasing rear data acquisition options as well. Features available in their subscription app provide an absolute amazing review of your bike. (don’t forget to check out the “how” feature after this for more info on the system)
Rob: We have a balance chart that compares front and rear compression and rebound strokes. It’s a patent pending data analysis developed testing with Greg Minnaar, Jason Marsh and others. Basically, it calculates bike balance and provides a nice visual. As you make changes to your high/low speed damper settings for front and rear, you will see the slopes of the lines change. When they match, the bike is balanced, at least mathematically. Rider feeling is still important to determine the correct balance. MotionIQ just quantifies what is happening.

Here’s a screenshot of Cody’s front/rear balance on compression. You can see the lines are <10% different. A great looking balance based on our experience. The blue line is fork, the orange is shock. These are not actual speeds of the compression strokes (y axis). The data has been normalized to coincide with the stroke length differences between his front and rear. (IE, 170 front, 140 rear)
MotionIQ analyzes a bike, not just a damper by itself. To set up a bike, you need a bike file we provide. It has all of the details about the bike including geometry and leverage curve. From this, we compare front and rear axle motion.
This is one of the most impressive aspects to the MotionIQ system. Rather than guessing what the bike is doing based on shock shaft speed, MotionIQ calculates the rear axle motion and compares it to the front. Forks, well, forks don’t have leverage ratios, pedaling platforms, etc. Rear shocks do. If you’re looking for real data on your bike’s balance the data acquisition has to factor what the bike is doing and when.
Rob: Suspension should reduce vibration and help you maintain control. By changing Cody’s setup, his suspension was doing more work. By letting his suspension do more work, he was able to ride the bike the same way and go faster. His top 10 result on a course that was brutal speaks for itself.
Joe: When you can make something easier why wouldn’t you? MotionIQ provided more than data and graphs. Additionally, crucially, it provided confidence for a rider. Attacking a course knowing “this is working” without a doubt is an awesome advantage. It saved testing. Which means it saved time and particularly important, energy. Over-riding before a race generally hinders physical as well as mental reserves.
Cody: By the end we softened the fork quite a bit and stiffened up the rear shock some. Both changes I would of never made honestly without the data. In fact I probably would of done the opposite and gone down a rabbit hole of a whole lot of bad without the data to guide us. So it was a huge bonus to have for the race!
Cody went on to finish 7th at the EWS Northstar – his best finish to date on the Enduro World Series.
Want to learn more about Motion Instruments MotionIQ system? BikeCo has you covered. Learn more about the “how” of mountain bike suspension data acquisition as well as why it’s for more than pro race teams here.
Special thanks to Rob Pryzkucki from Motion Instruments and Anthony Cupaiuolo from First Tracks Productions for imagery as well as video access!